Track every dollar earned.
We retrieve, aggregate, and analyze every trade across YieldMax® funds and turn it into clean, auditable insight so you spend minutes understanding, not hours compiling.
What you’ll find
The website will launch with these four initial views to help investors study trades & view performance.
PAYOUT EXPECTATIONS
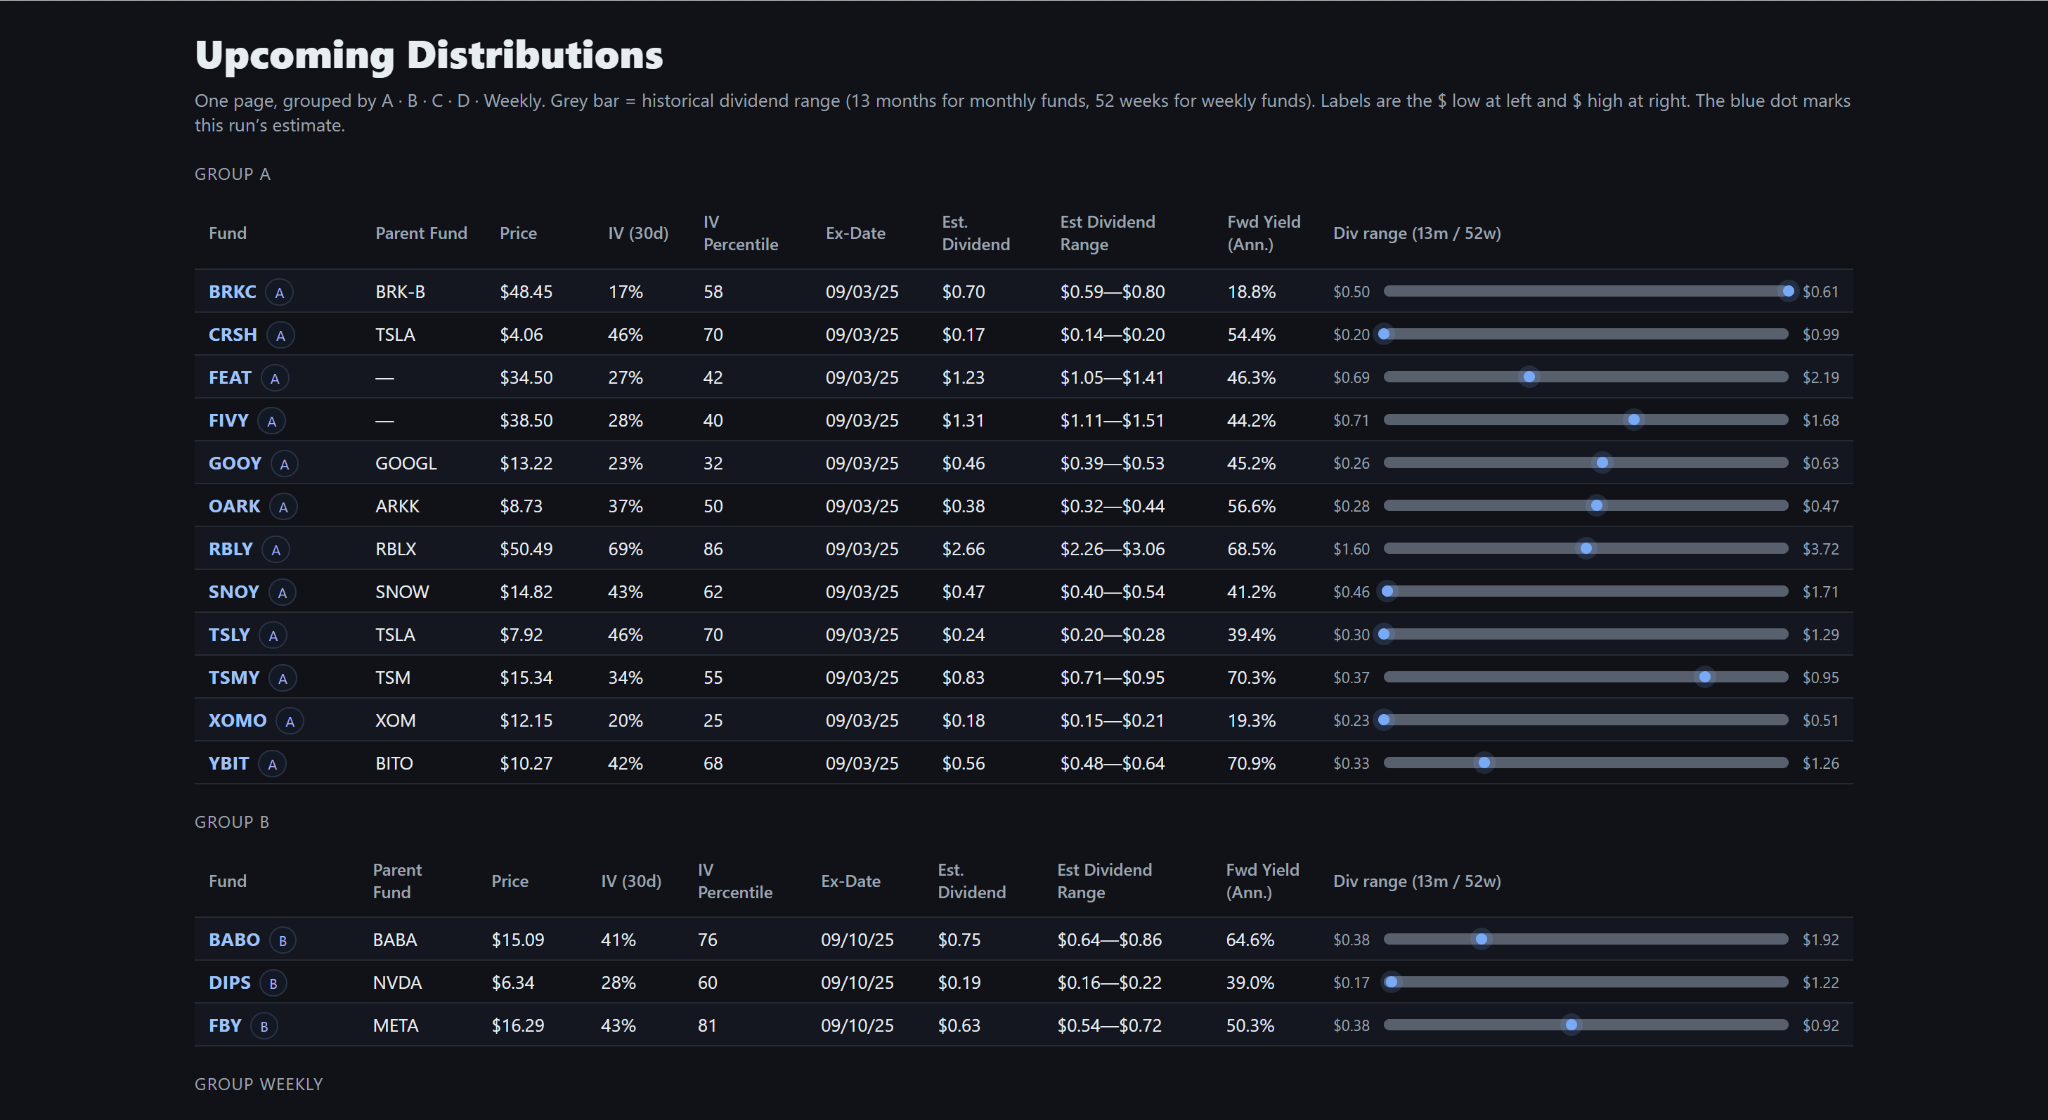
Upcoming Distributions
Investors buy YieldMax® for income. This view estimates where the upcoming distribution will likely land based on a proprietary blend of IV & earnings in the period.
- Set cash‑flow expectations quickly.
- Compare funds on a normalized range with IV context.
- Time entries and trims around ex‑dates and schedule groups.
TRACE EVERY LEG
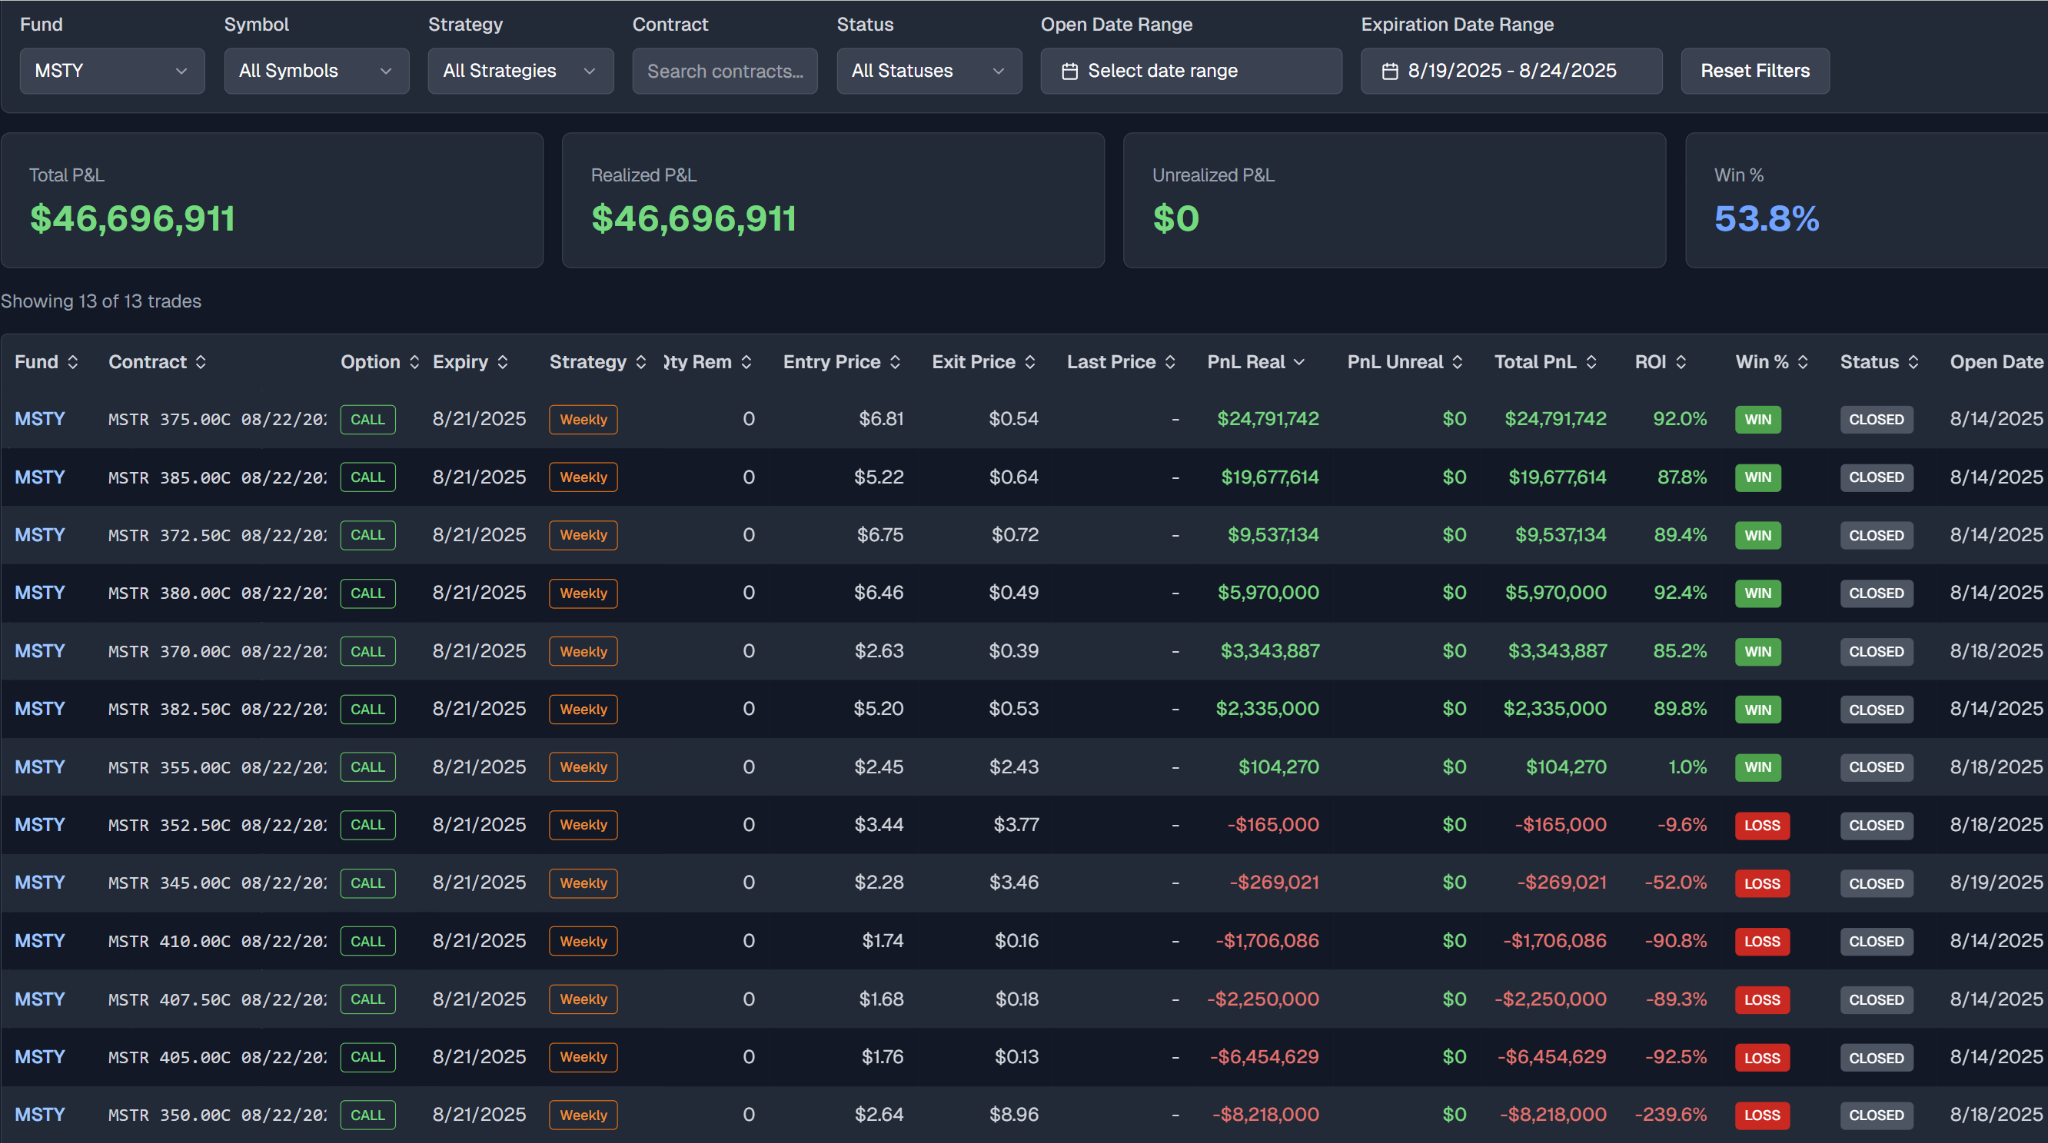
Detailed Trades
Evaluate realized & unrealized P&L, see active options positions vs cost basis, and track which trades are open right now.
- Realized / Unrealized P&L by leg and position.
- Live position stack: strikes, qty, cost basis, breakevens.
- Track today’s opens, closes, and rolls at a glance.
CASH‑FLOW CADENCE
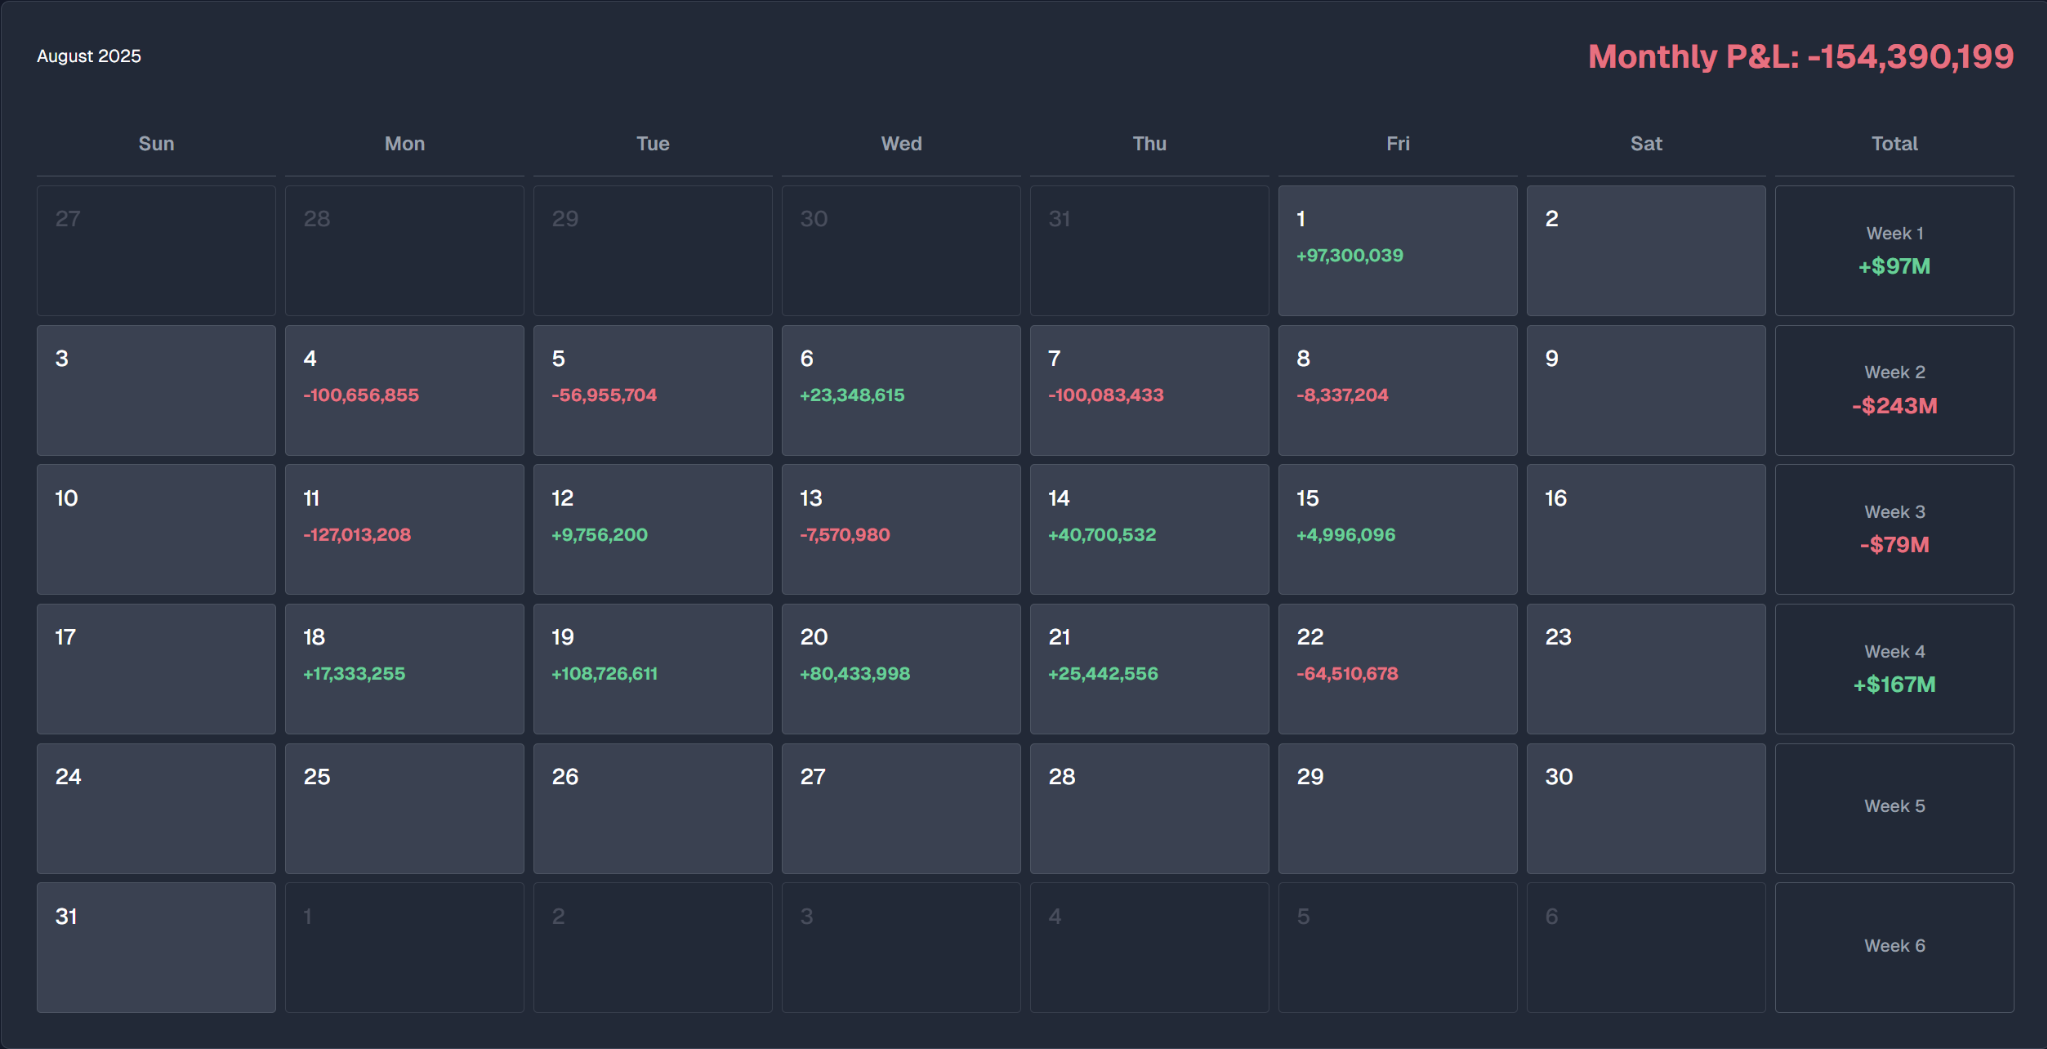
Calendar View
Easily see how a fund’s portfolio is trending by looking at realized gains and losses — a visually friendly way to see how much profit the fund is making each day.
- Daily totals roll to weekly and month‑to‑date.
- Best / worst day markers with quick trend read.
- Confirm that the month’s payout matches realized drivers.
STRUCTURE DRIVERS
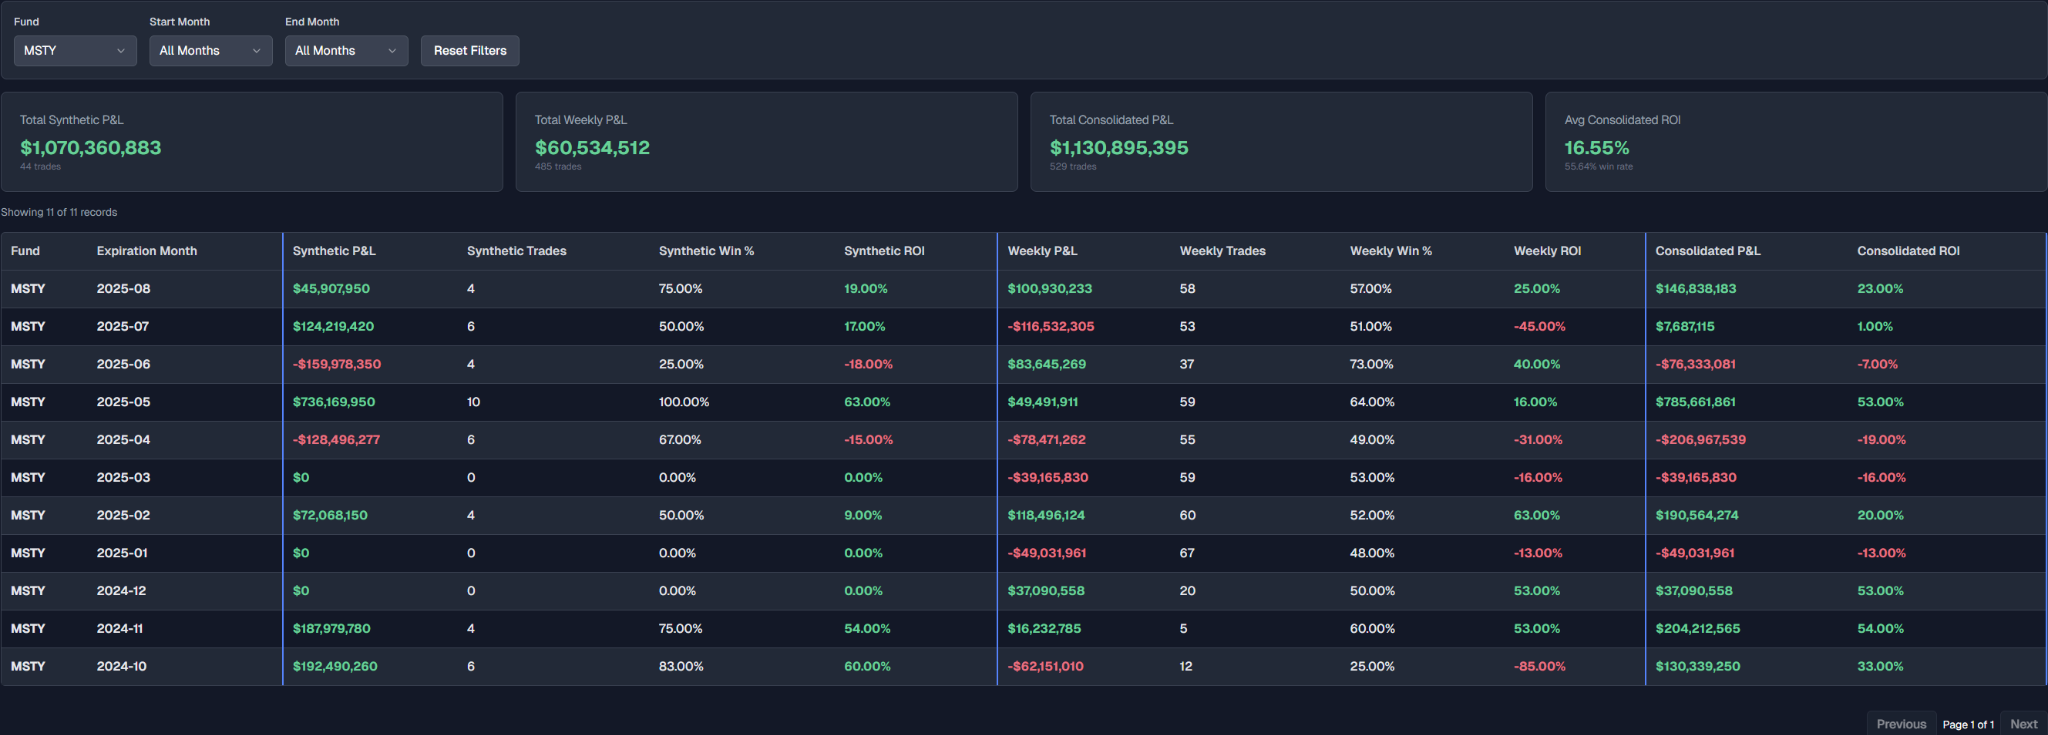
Performance by Expiry
Understand how the fund has historically made money — and whether current positioning (% uncovered, % OTM) supports that edge.
- Historical contribution by structure with win‑rate / ROI.
- Current mix: % uncovered and average % OTM.
- Consistency check: today’s mix vs historical edge.
Pricing
Pro no ads
- Ad‑free experience
- Extended history
- Access to fund analytics (future release)
Important: This is not financial advice. YieldTrackPro LLC is not affiliated with YieldMax® or its advisers.
We know accuracy matters. Although the platform uses a robust professional‑grade engine and every effort is made to audit results, occasional errors may occur due to incomplete data or aggregation challenges. We actively work to minimize these and welcome user feedback to improve the platform.